[prefix]
[current_date]
Introduction
Money Spent On Clothes Statistics: Shopping is the most favored activity without the need for a specific occasion. Across the globe, shoppers purchase clothing and accessories either at physical stores or online. The statistics presented in this Money Spent On Clothes report demonstrate that the global clothing market has already reached trillions in revenue across all sectors. Expenditure on clothing is prevalent across all age groups. This indicates that preferred shopping methods by different generations include online shopping, department stores, and large retail stores.
In the foreseeable future, consumer trends may evolve due to technological advancements, but the tradition of clothing shopping remains constant, promising a prosperous outlook for the global apparel industry.
Editor’s Choice
USD 230.90 per capita revenue is estimated for the global market by 2024.
The United States is anticipated to lead in revenue generation in the clothing industry, expected to reach USD 359 billion by 2024.
The global apparel market is forecasted to grow to USD 1.79 trillion by 2024, with a compound annual growth rate (CAGR) of 2.72% up to 2027.
An average American owns 75 to over 100 clothing items.
Amazon dominates online apparel sales, accounting for 76% of purchases through smartphones.
On average, households allocate about 3.8% of their total income towards annual clothing expenses.
Teenagers aged 18 to 19 spend the most on clothing, averaging between USD 1,300 and USD 2,000 annually. This is followed by 15 to 17-year-olds spending USD 800 to USD 1,200, and 12 to 14-year-olds spending between USD 500 and USD 700.
Among American Gen Z shoppers, 17% preference is for Amazon, while others opt for stores like Lulu’s, ASOS, Target, Walmart, and Costco.
In 2023, Goodwill emerged as the leading second-hand online apparel store in the USA, with 69% brand awareness.
Families earning between USD 20,000 and USD 70,000 spend an average of USD 1,700 annually on clothing.
Global Apparel Industry Statistics
The global apparel industry is set to reach USD 1.79 trillion in 2024.
A growth rate of 2.72% is expected, targeting a higher value by 2027.
The United States is poised to generate the highest revenue, reaching USD 359 billion by 2024.
On average, each individual may purchase 24.1 clothing pieces in 2024.
By 2027, the total number of clothing pieces sold globally could reach 193.7 billion.
Women’s clothing is projected to be the top-selling category, with sales estimated at USD 0.94 trillion in 2024.
Per capita expenditure on apparel is likely to be USD 230.90 based on the global population.
A 1.3% rise in clothing purchase quantity is forecasted for 2025.
General Money Spent On Clothes Statistics
Americans lead globally in apparel spending compared to consumers in other countries.
By 2025, the global clothing market is projected to hit USD 2.25 trillion.
The e-commerceSales in the clothing sector worldwide are dominated.
3.8% of their income is annually allocated by households to clothing purchases.
Online clothing shoppers in the USA account for 75%.
The largest portion of online apparel sales is commanded by Amazon, with 76% conducted through smartphones.
Between 75 to 100+ pieces of clothing are owned by an average American, typically wearing an item at least 7 times before disposal.
Global consumer spending on clothing and footwear is anticipated to reach USD 2.9 trillion by 2029, marking a 20.44% increase from 2024 to 2029.
The primary reason for returning online clothing purchases is an incorrect fit, accounting for 38% of returns.
Online clothing sales surge by 46.2% during the holiday season, with spending priorities being gift cards (55%), clothing and accessories (49%), books, video games, or other media (28%), and personal care and beauty products (25%).
Money Spent On Clothes Statistics By Demographics
According to a report by McKinsey titled The State of Fashion, consumers under 20 years old purchase clothing items that are not designed gender-wise.
Age Group
Yearly Spend on Clothing
0 – 2 Years
Approximately $500
3 – 5 Years
Approximately $350
6 – 8 Years
Approximately $400
9 – 12 Years
Approximately $450
13 – 15 Years
Approximately $500
(Source: billpin.com)
Primarily, parents of children spend below $500 for their kids aged from 0 to 15 years. However, those aged between 0 to 2 years and 13 to 15 years spend at least $500 on clothes shopping annually.
Age Group
Average Annual Spending on Clothing
12-14 years
$500-$700
15-17 years
$800-$1200
18-19 years
$1300-$2000
(Source: billpin.com)
Annually, the highest spending on clothing by teenage groups is observed in consumers aged between 18 to 19 years resulting in $1,300 to $2,000, followed by 15 to 17 years – $800 to $1200 and 12 to 14 years between $500 to $700.
By Average Family Spending By Income Level
Income Level
Average Annual Clothing Budget
Low Income (
$550 – $750
Middle Income ($20,000 – $70,000)
$1,700
High Income (>$70,000)
$2,000 – $3,500
(Source: billpin.com)
Families with an income level of $20,000 to $70,000 allocate an average of $1,700 annually for clothing expenses. Less than $20,000 income households spend between $550 to $750, while households with an income exceeding $70,000 spend between $2,000 to $3,500.
By Types Of Preferred Stores For Apparel Shopping By Generation
(Reference: statista.com)
Preferably shopping online on Amazon (17%), Lulu’s, and ASOS, the majority of American Gen Z clothing shoppers have their preferences set. On the other hand, some opt for Big Box Stores like Target, Walmart, and Costco, among others. Equally, 13% lean towards Fast Fashion stores and department stores. The rest choose to shop at Outlets, secondhand stores, and specialty stores.
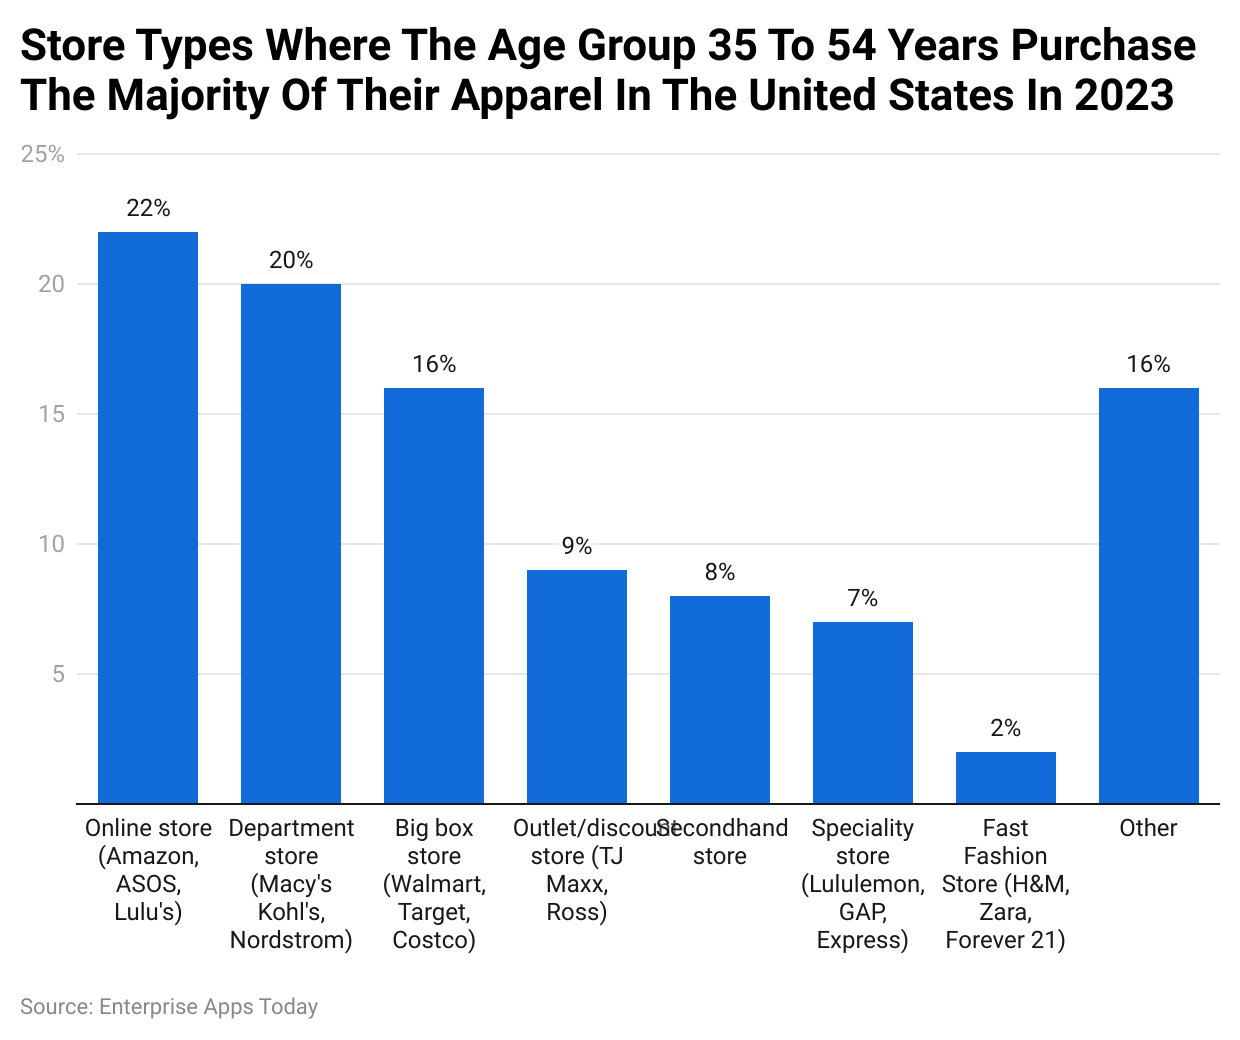
For American consumers aged 35 to 54 years, the online shopping trend is prevalent with a preference for various e-commerce sites (22%). They also show interest in Department stores (20%) and Big Box Stores (16%). Unlike Gen Z, there is a lower demand among this age group for outlet or discount stores, secondhand stores, specialty stores, and fast fashion stores.
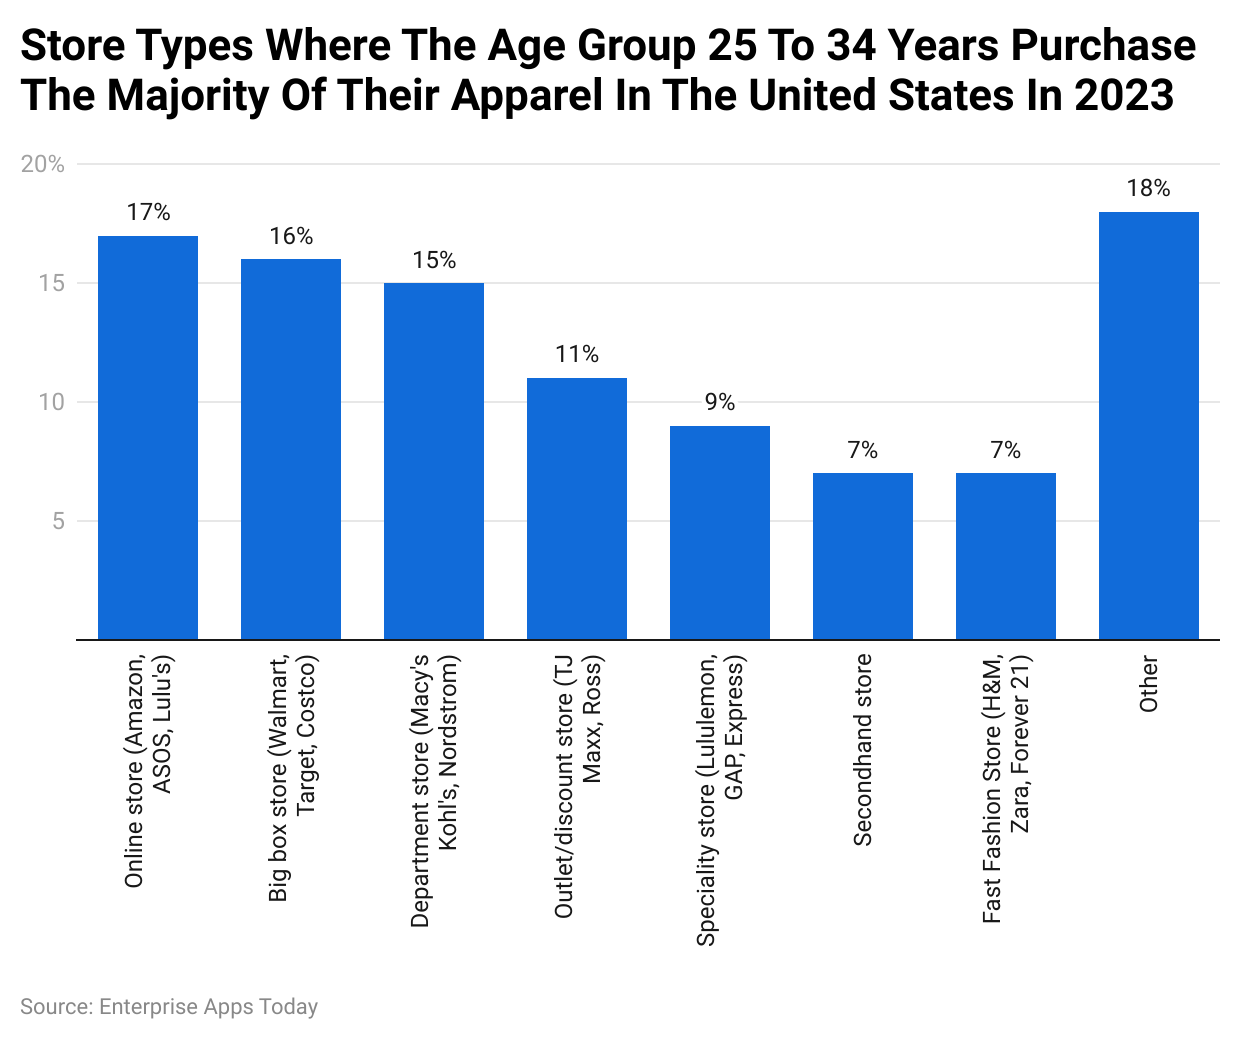
Despite different generations, clothing shopping trends remain quite similar. People aged 25 to 34 lean towards online shopping, big box stores, and department stores for their apparel needs.
By Product Category
(Source: optinmonster.com)
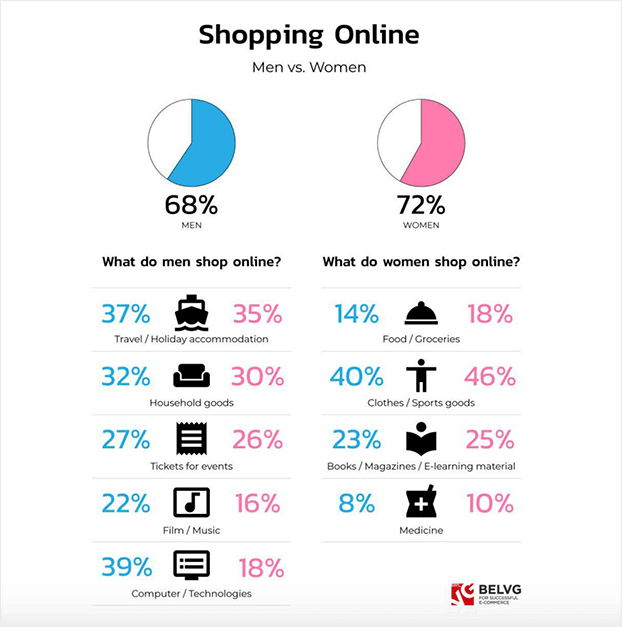
When it comes to online shopping, women exhibit a higher inclination towards clothing than men do, with a preference rate of 40%. In contrast, men show a preference for booking travel and holiday accommodations.
Money Spent On Clothes Statistics Spending Pattern
The average yearly family expenditure on clothing in the USA amounts to $1,700, with individual spending averaging $1,932.
Additionally, women’s clothing expenditure can reach $2,000 per year on average.
The average monthly expenditure on adult clothing is $161, totaling $1,700 annually.
Similarly, American women allocate an average of $2,000 annually for clothing purchases.
By Monthly Amount Spent On Online Clothing Purchases
(Reference: statista.com)
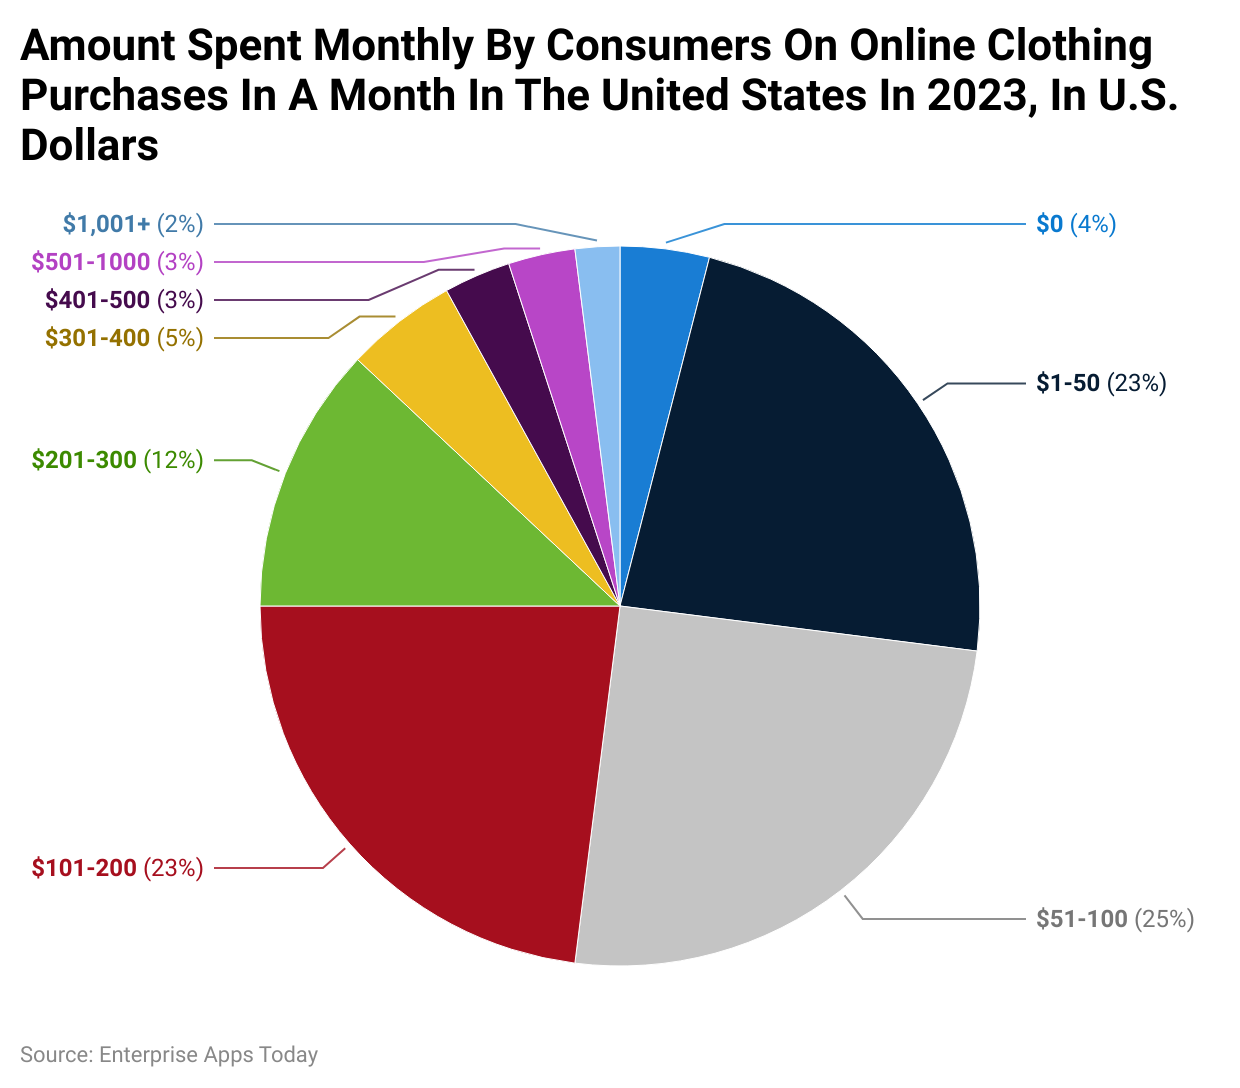
According to the statistics of Money Spent On Clothes in 2023, 25% of American online clothes shoppers spent between $51 to $100, while 23% spent between $1 to $200 in a month. Only 2% of buyers splurged over $1001 on clothing per month.
By Leading Second- Hand Apparel Online Shops
(Reference: statista.com)
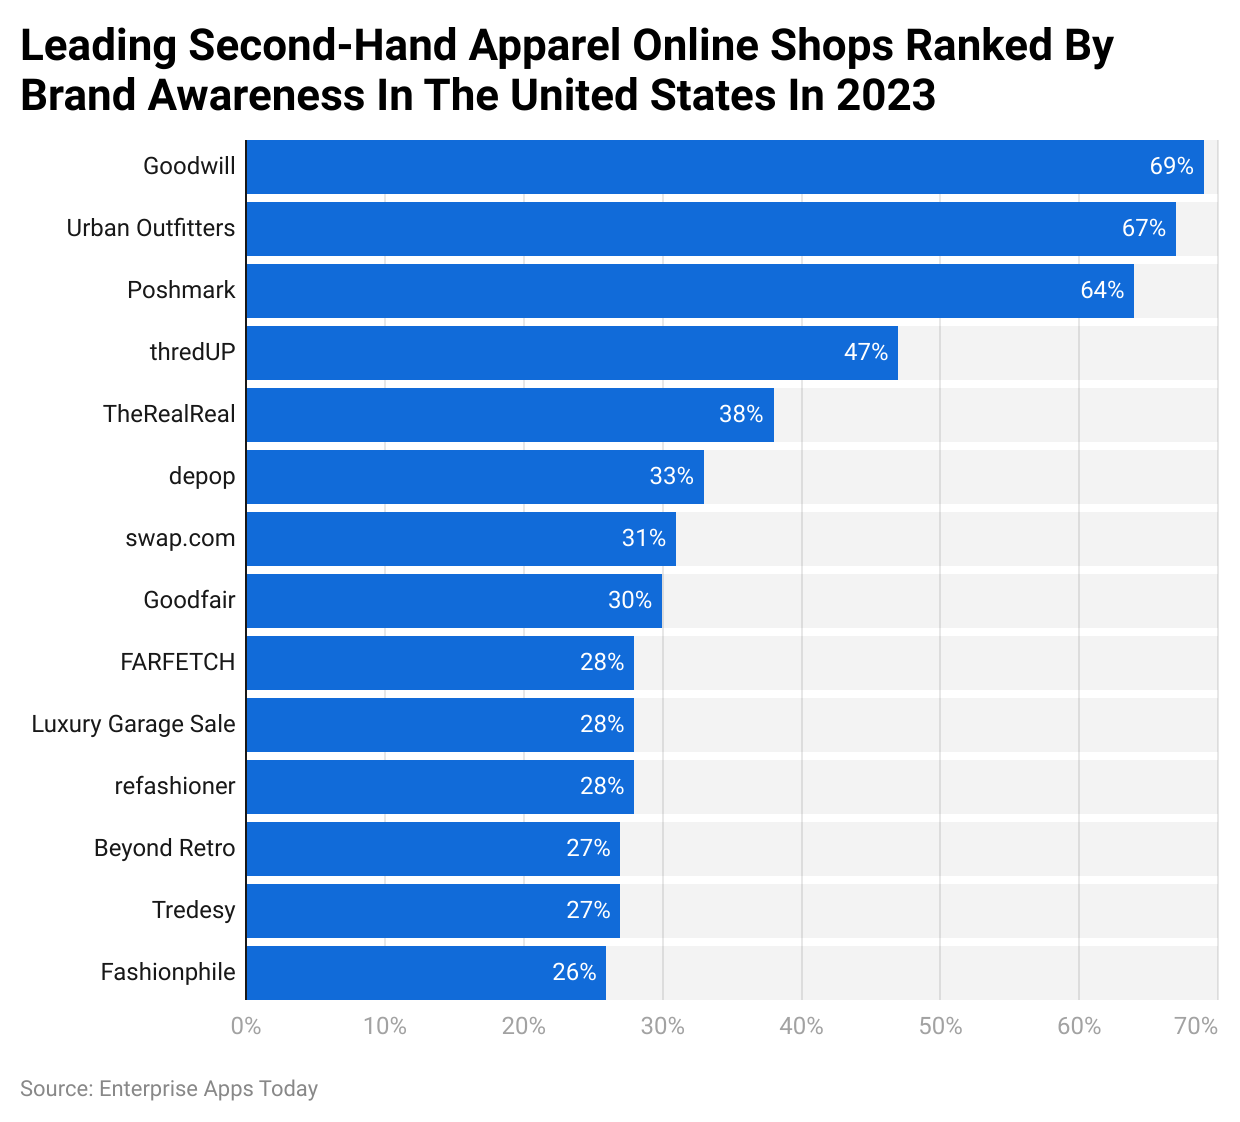
In the USA in 2023, Goodwill emerged as the primary second-hand apparel online shop with 69% brand awareness. Urban Outfitters and Poshmark followed closely with 67% and 64% awareness, respectively. Other notable brands included thredUP, TheRealReal, Depop, Swap.com, Goodfair, and FARETECH, among others.
By Spending Per Online Shopper By Category
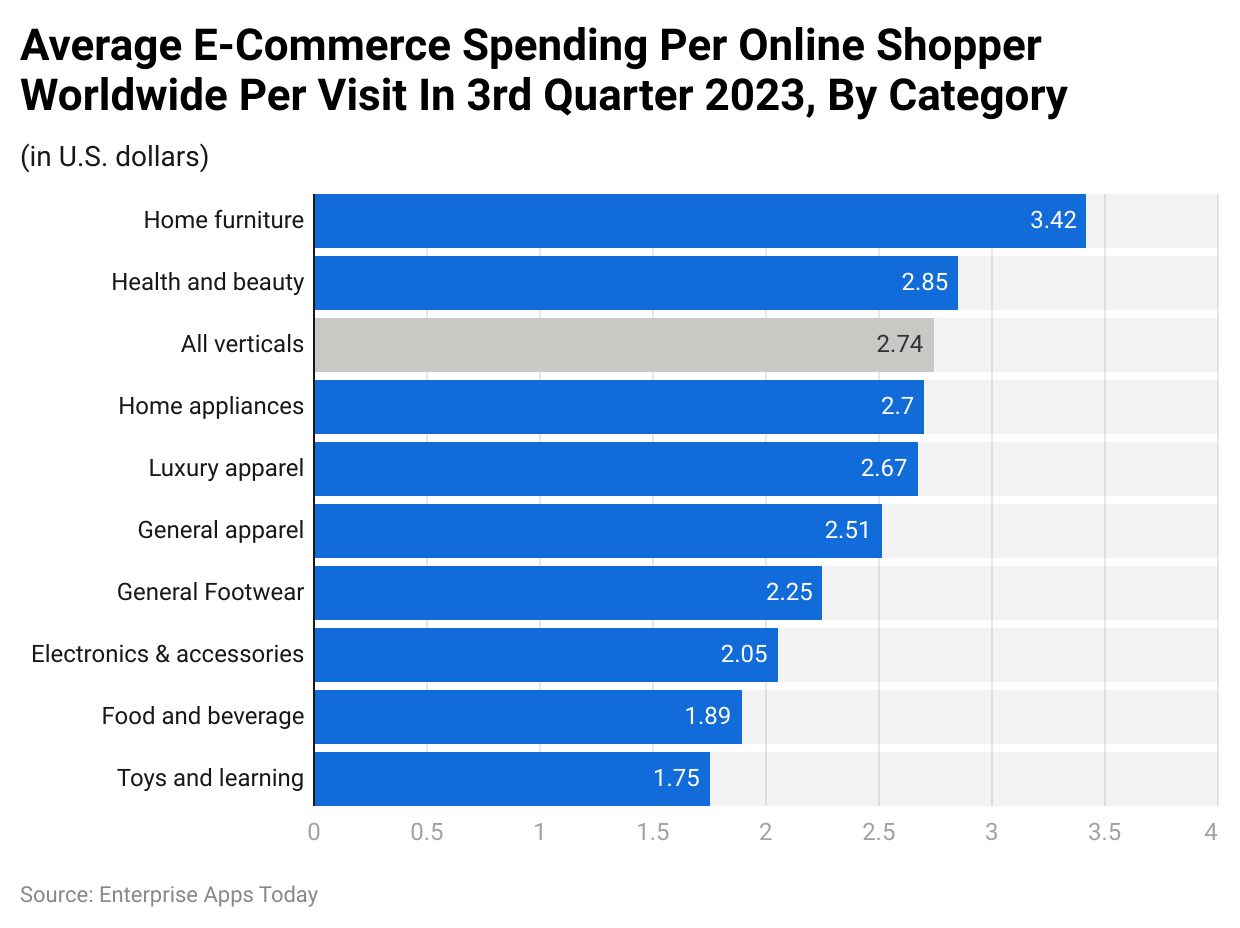
By general apparel, the average spending per online shopper worldwide is $2.51. The highest spending for categories includes Home furniture $3.42, health and beauty $2.85, and home appliances $2.7.
By Online Shopping
(Reference: capitaloneshopping.com)
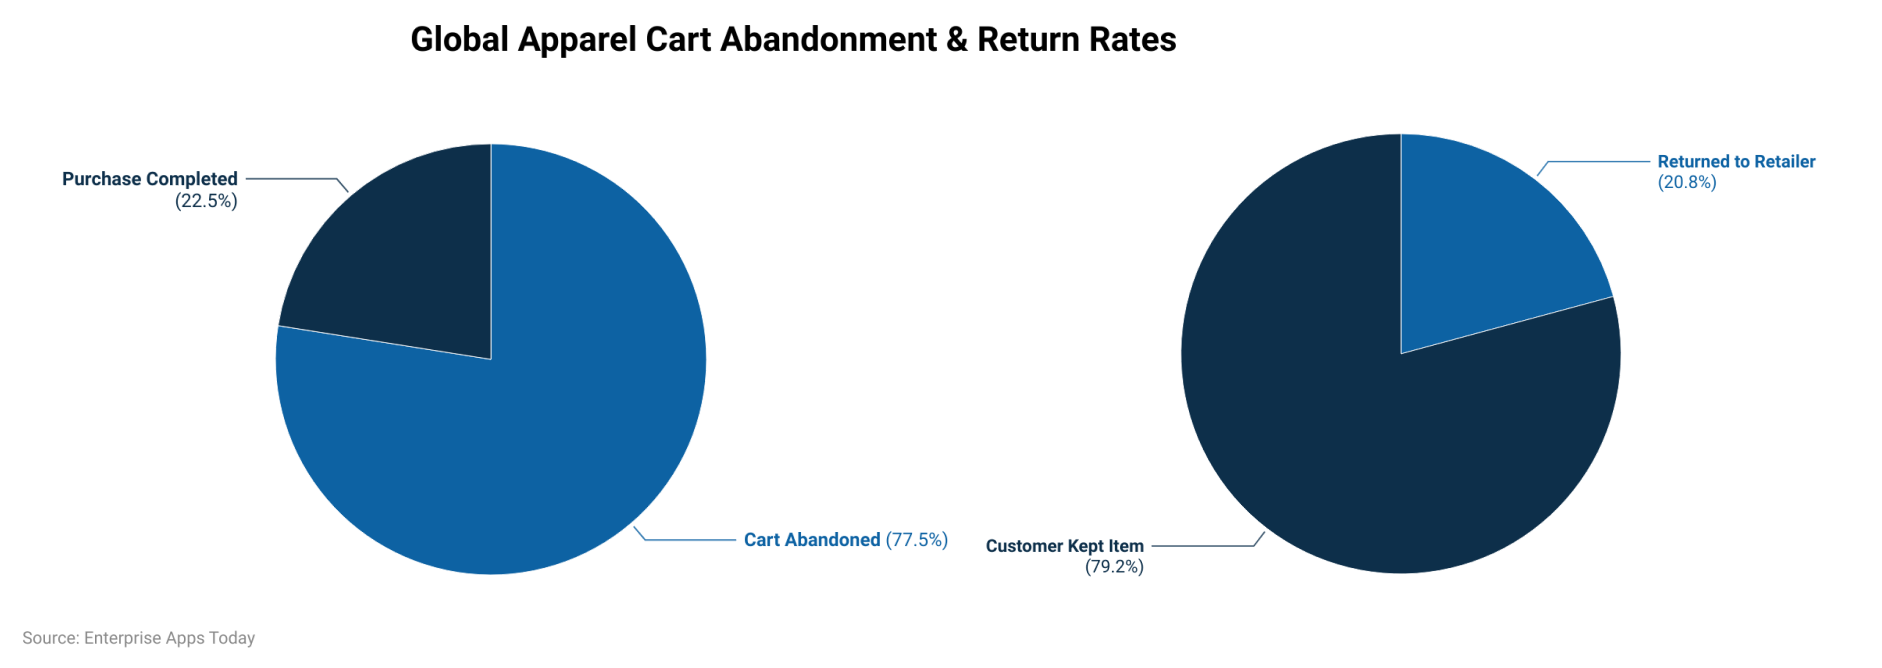
Regarding global apparel shopping, the cart abandonment rate is 77.5%, while the purchase completion rate stands at 22.5%. For online clothing purchases, 79.2% of customers retain the product they receive, with 20.8% opting to return it to retailers.
By Devices Used In Online Shopping By Product Category

Mobile is the primary choice for online shopping in segments like apparel, beauty and personal care, luxury and jewelry, home and furniture, with over 70% contribution in these categories, followed by desktop and tablet.
By Deciding Factors
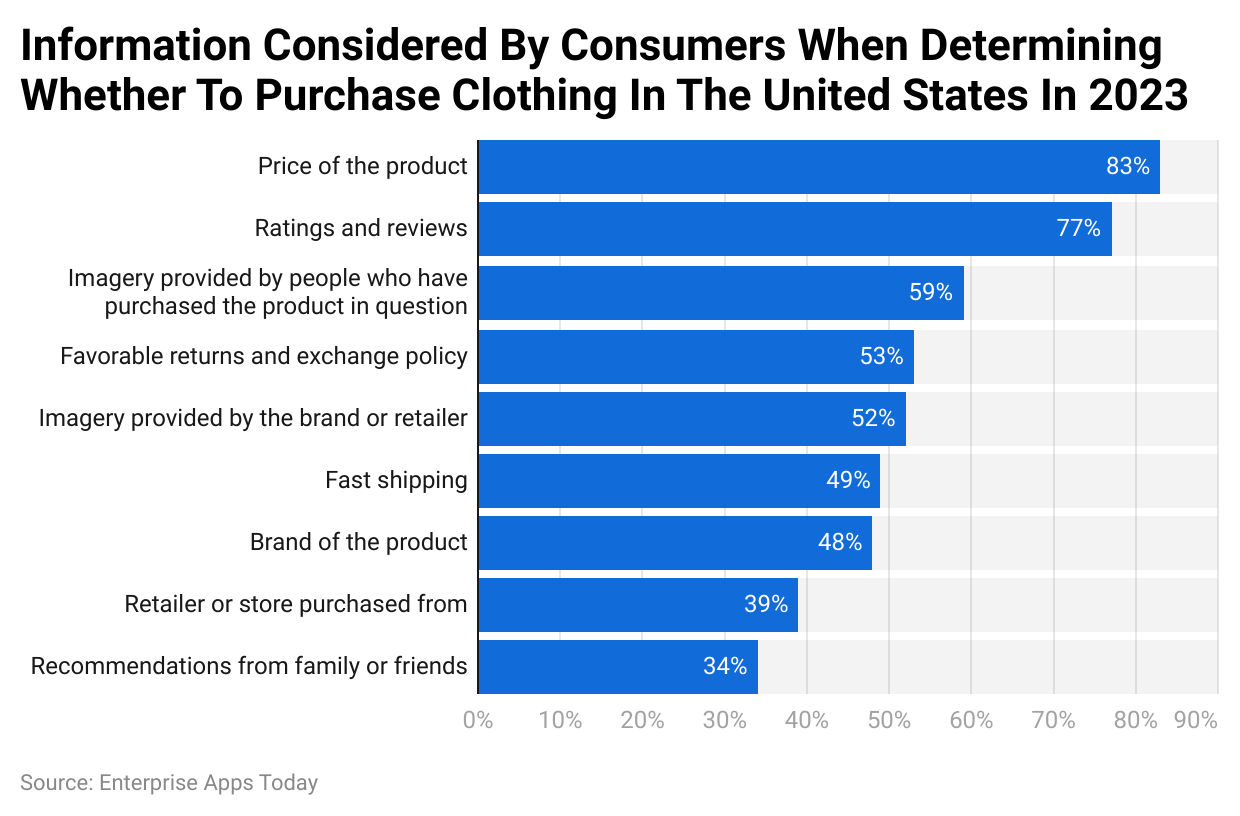
Money Spent On Clothes Statistics show that the price of the product is the top deciding factor for Americans when shopping for clothes, accounting for 83%. Ratings and reviews from previous buyers (77%) and product images (59%) are also significant factors. American shoppers also consider return policies, brand-provided images, shipping times, brand reputation, and recommendations in their purchase decisions.
Conclusion
The fashion industry, especially clothing, is influenced by market trends. Fashion is not just limited to the entertainment and media sectors but is an integral part of people’s lives, driving regular shopping behavior. Digitalization has significantly boosted spending on clothes through eCommerce sales. Today, the garment industry has crossed a trillion dollars globally, reflecting the ever-changing market trends that drive consumer spending.
until the market faces a stagnant phase.
[3px] border-t-[3px] p-4 border-[#1d598f] my-4″ style=”box-shadow: 0 0 14px rgb(9 38 66 / 8%);”>
Sources
How much is the Clothing industry valued in 2024?
The apparel market around the world is valued at $703.11 billion and is expected to grow at a CAGR of 7.2%.
Who shops more clothes men or women?
According to a report by LinkedIn, women are more likely to do clothing shopping than men.
What is the average money spent on clothes every year?
Every year in the US, men spend around $325 while women spend $545 on clothing shopping.
Thank you for reading this article titled: Money Spent On Clothes Statistics 2024 By Demographics, Generation And Monthly Amount Spent
Data is from 2023 and 2024 and forecast data is for 2025 and 2026. We also expand the forecast data to 2027 and 2028.
* This information was taken from various sources around the world, including these countries:
Australia, Canada, USA, UK, UAE, India, Pakistan, Philippines, Indonesia, Nigeria, Tanzania, Kenya, US, United Kingdom, United States of America, Malaysia, U.S., South Africa, New Zealand, Turkey, United Arab Emirates.
Afghanistan, Albania, Algeria, American Samoa, Andorra, Angola, Anguilla, Antarctica, Antigua and Barbuda, Argentina, Armenia, Aruba, Australia, Austria, Azerbaijan.
Bahamas, Bahrain, Bangladesh, Barbados, Belarus, Belgium, Belize, Benin, Bermuda, Bhutan, Bolivia, Bosnia and Herzegovina, Botswana, Bouvet Island, Brazil, British Indian Ocean Territory, Brunei Darussalam, Bulgaria, Burkina Faso, Burundi.
Cambodia, Cameroon, Canada, Cape Verde, Cayman Islands, Central African Republic, Chad, Chile, China, Christmas Island, Cocos (Keeling Islands), Colombia, Comoros, Congo, Cook Islands, Costa Rica, Cote D’Ivoire (Ivory Coast), Croatia (Hrvatska), Cuba, Cyprus, Czech Republic.
Denmark, Djibouti, Dominica, Dominican Republic, East Timor, Ecuador, Egypt, El Salvador, Equatorial Guinea, Eritrea, Estonia, Ethiopia, Falkland Islands (Malvinas), Faroe Islands, Fiji, Finland, France, Metropolitan, French Guiana, French Polynesia, French Southern Territories.
Gabon, Gambia, Georgia, Germany, Ghana, Gibraltar, Greece, Greenland, Grenada, Guadeloupe, Guam, Guatemala, Guinea, Guinea-Bissau, Guyana, Haiti, Heard and McDonald Islands, Honduras, Hong Kong, Hungary, Iceland, India, Indonesia, Iran, Iraq, Ireland, Israel, Italy.
Jamaica, Japan, Jordan, Kazakhstan, Kenya, Kiribati, North Korea, South Korea, Kuwait, Kyrgyzstan, Laos, Latvia, Lebanon, Lesotho, Liberia, Libya, Liechtenstein, Lithuania, Luxembourg.
Macau, Macedonia, Madagascar, Malawi, Malaysia, Maldives, Mali, Malta, Marshall Islands, Martinique, Mauritania, Mauritius, Mayotte, Mexico, Micronesia, Moldova, Monaco, Mongolia, Montserrat, Morocco, Mozambique, Myanmar.
Namibia, Nauru, Nepal, Netherlands, Netherlands Antilles, New Caledonia, New Zealand (NZ), Nicaragua, Niger, Nigeria, Niue, Norfolk Island, Northern Mariana Islands, Norway.
Oman, Pakistan, Palau, Panama, Papua New Guinea, Paraguay, Peru, Philippines, Pitcairn, Poland, Portugal, Puerto Rico, Qatar, Reunion, Romania, Russia, Rwanda, Saint Kitts and Nevis, Saint Lucia, Saint Vincent and The Grenadines, Samoa, San Marino, Sao Tome and Principe.
Saudi Arabia, Senegal, Serbia, Seychelles, Sierra Leone, Singapore, Slovakia, Slovenia, Solomon Islands, Somalia, South Africa, South Georgia and South Sandwich Islands, Spain, Sri Lanka, St. Helena, St. Pierre and Miquelon, Sudan, Suriname, Svalbard and Jan Mayen Islands, Swaziland, Sweden, Switzerland, Syria.
Taiwan, Tajikistan, Tanzania, Thailand, Togo, Tokelau, Tonga, Trinidad and Tobago, Tunisia, Turkey, Turkmenistan, Turks and Caicos Islands, Tuvalu, Uganda, Ukraine, United Arab Emirates (UAE), UK (United Kingdom), USA (United States of America, U.S.), US Minor Outlying Islands.
Uruguay, Uzbekistan, Vanuatu, Vatican City State (Holy See), Venezuela, Vietnam, Virgin Islands (British), Virgin Islands (US), Wallis and Futuna Islands, Western Sahara, Yemen, Yugoslavia, Zaire, Zambia, Zimbabwe.
Post Title: Money Spent On Clothes Statistics 2024 By Demographics, Generation And Monthly Amount Spent
Last Updated: September 6, 2024
Author :
Publish date : 2024-09-11 22:55:00
Copyright for syndicated content belongs to the linked Source.
Author : theamericannews
Publish date : 2024-09-12 09:59:17
Copyright for syndicated content belongs to the linked Source.
